Changes in the condition of surface water bodies are directly linked to risks to human health and biodiversity. Chemicals that can accumulate in food webs and substances that pose a risk to drinking water are being detected in these waters. Furthermore, pollution increases the likelihood of waterborne disease outbreaks.
Pollution of rivers, lakes and groundwater
The European Environment Agency (EEA) 2026 report shows that Europe’s water resources remain under significant pressure from human activities and a changing climate, and targets for sustainable rivers, lakes and groundwater remain far from being met.
According to the Europe’s State of Water 2024 report, only around 37% of surface water bodies in Europe achieved “good” or “high” ecological status, and only 29% were considered to have “good chemical status” in 2021. The situation for groundwater is relatively better, but significant risks remain due to pollution by nitrates and pesticides.
The ecological and chemical status of waters is assessed in accordance with the requirements of the EU Water Framework Directive. This directive set a target of achieving “good status” for all water bodies by 2015, but the deadline was postponed to 2027 due to insufficient progress.
EEA analysts have identified several key sources of problems that systematically degrade water quality:
Agriculture remains the largest source of pressure, including intensive water abstraction and the introduction of nutrients (fertilizers) and pesticides into aquatic systems. This leads to eutrophication, the spread of chemical pollutants, and the deterioration of ecosystem quality.
Chemical pollution remains high: substances such as mercury, persistent organic pollutants, and pesticides continue to affect the health of rivers and lakes, despite measures to limit emissions.
Hydromorphological changes (e.g., dredging, dams, and river channel modifications) disrupt natural processes, reducing the ability of ecosystems to cleanse and regenerate themselves.
NIA “Ecology”
These processes reduce the ability of aquatic organisms to maintain stable communities and degrade the natural functions of rivers and lakes.
Climate change is increasing pressure on Europe’s water resources: more frequent droughts, extreme precipitation, and floods are accelerating the degradation of rivers and reservoirs and exacerbating water stress. According to analysis, approximately 30% of Europe’s territory and approximately 30% of its population face water shortages annually. Climate change can also increase the concentration of pollutants in water and increase health risks: rising temperatures facilitate the growth of pathogens, and pollutants become more active.
The EEA report shows that despite years of regulation and policy, progress in improving water quality remains limited. Existing measures have prevented further deterioration in some regions, but widespread improvements in the status of water bodies have not been achieved.
To achieve the goals of the EU directive and improve the resilience of water systems in the face of climate change, experts propose:
— strengthening controls over agricultural emissions and water use;
— expanding measures to restore the hydromorphological conditions of rivers and coastal ecosystems;
— integrating climate and water policies to improve overall resilience;
— more actively implementing innovative approaches to water monitoring and treatment, including digital methods for water quality assessment.
Water resources are a key element of a sustainable ecosystem, economy, and public health. Despite years of efforts to improve water quality and management, the report shows that most surface water and a significant share of groundwater resources in Europe are still far from being in “good status,” as required by EU law.
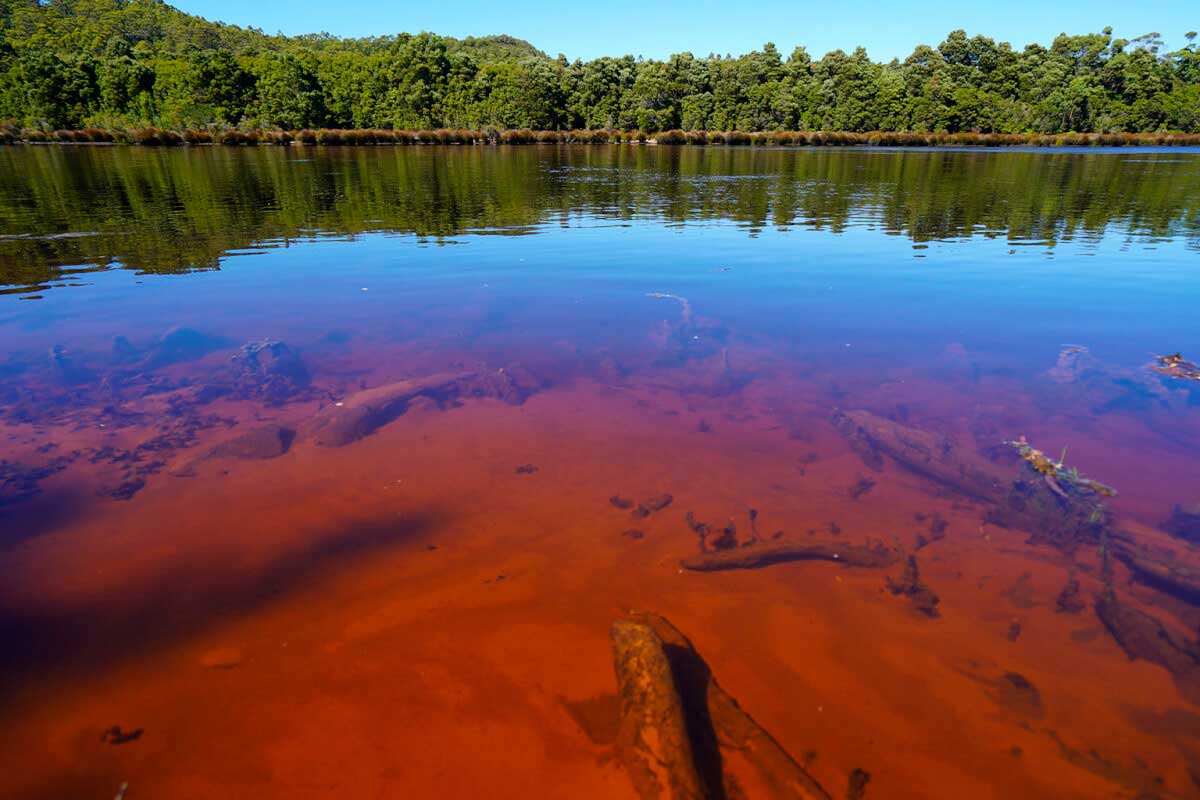
In Tasmania, the King River remains one of the most glaring examples of long-term environmental damage: scientists call certain sections of it “biologically dead.” This is due to more than a century of copper mining, the effects of which remain to this day.
The main source of pollution is the historic mining of the Mount Lyell mine, which began in the late 19th century. For decades, mining waste was directly discharged into the river’s tributaries, primarily the Queen River, from where the pollution spread throughout the system. Even after the mine’s closure and the cessation of large-scale discharges, the problem persists. Millions of tons of sulfide rocks remain in waste dumps and tailings dams, which, when exposed to water and air, form acidic drainage. As a result, heavy metals such as copper, zinc, and iron continue to flow into the river.
The consequences are evident at the ecosystem level. In the lower reaches of the river, sensitive aquatic species—insects that form the basis of the food chain—have virtually disappeared. Instead of a diverse ecosystem, only a few pollution-resistant species remain. Fish are virtually absent from the most polluted areas.
The problem is exacerbated by the fact that pollution accumulates in bottom sediments and floodplains. More than 90% of metals are transported by sediment, making them a long-term source of secondary pollution. During floods, these substances reenter the water and spread downstream.
King River. Stefan Lovgren
The impact extends beyond the river itself. Pollution reaches Macquarie Sound, where it accumulates in bottom sediments and poses additional risks to marine ecosystems, including rare fish species.
Visually, the river may appear “alive”—the water flows, the banks are covered with vegetation. However, as researchers note, beneath this superficial “normality,” a degraded system persists, in which basic ecological processes are disrupted.
The situation is complicated by climate factors. Western Tasmania experiences high rainfall, and heavy rainfall regularly washes away contaminated sediments, increasing the spread of toxic substances. Climate change and increased extreme precipitation are expected to further exacerbate this effect.
Despite decades of research and restoration efforts, the problem remains elusive. Pollution is cumulative, and its elimination requires large-scale and costly measures, including waste stabilization and watershed cleanup.
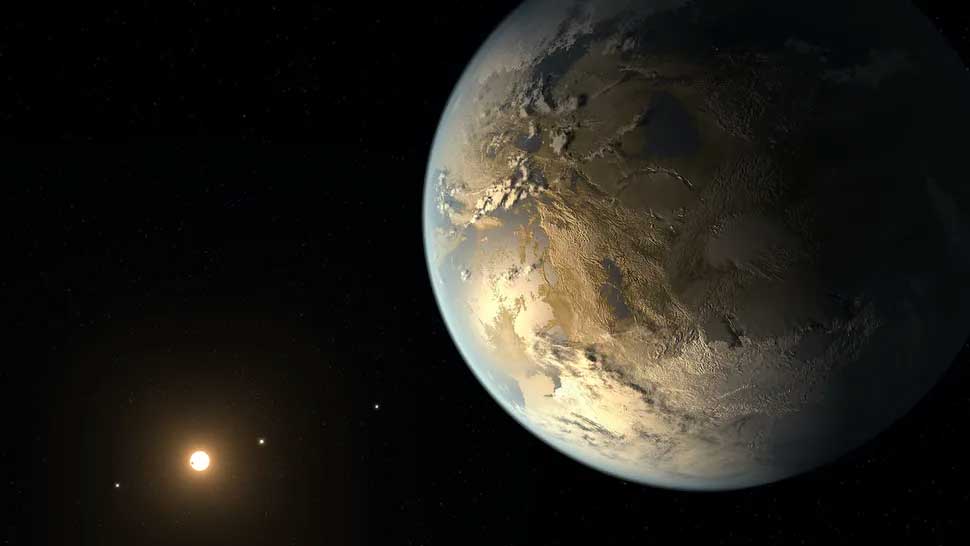
The King River’s history has become a shining example for other countries. Scientists note that similar “legacy” pollution is characteristic of hundreds of thousands of kilometers of rivers worldwide, particularly in regions with historical mining activities.
Changes in water levels in rivers
For the first time, a NASA-French-led space mission has tracked month-to-month changes in river levels across the globe over the course of a year and found significantly smaller fluctuations than predicted by previous models. Record-breaking drought in the Amazon likely impacted data collected by the Surface Water and Ocean Topography (SWOT) satellite. The findings also reveal new details about the underwater topography of riverbeds around the world.
Launched in 2022, the SWOT satellite is a collaboration between NASA and the French space agency CNES (Centre National d’Etudes Spatiales). It is the first satellite capable of surveying with high accuracy not only the ocean but also nearly all the world’s lakes and rivers. While SWOT does not measure the absolute volume of rivers, it can track changes in their width, surface level, and slope over time, NASA’s press service reported in March 2026.
Traditionally, hydrologists have relied on models to calculate changes in river volume or multiplied altimeter-derived height estimates by optical or radar width estimates. In contrast, the SWOT instrument measures both height and width simultaneously using its sensitive Ka-band Radar Interferometer (KaRIn), which reflects microwaves off the water surface and measures the time it takes for the signal to return. A study published in the journal Nature analyzed nearly 1.6 million such observations.
The analysis shows that water levels at approximately 127,000 river sites fluctuated between October 2023 and September 2024. Collectively, river volumes changed by nearly 83 trillion gallons (313 cubic kilometers). This is approximately 28% smaller than the lowest previous estimates, and this result is likely distorted by extremely dry conditions during this period in the Amazon, home to the largest river on Earth by volume.
Even during drought conditions, the Amazon River’s water levels fluctuated more throughout the year than any other river, gaining and losing more than 45 trillion gallons (172 cubic kilometers)—enough to cover the entire state of California with more than a foot of water.
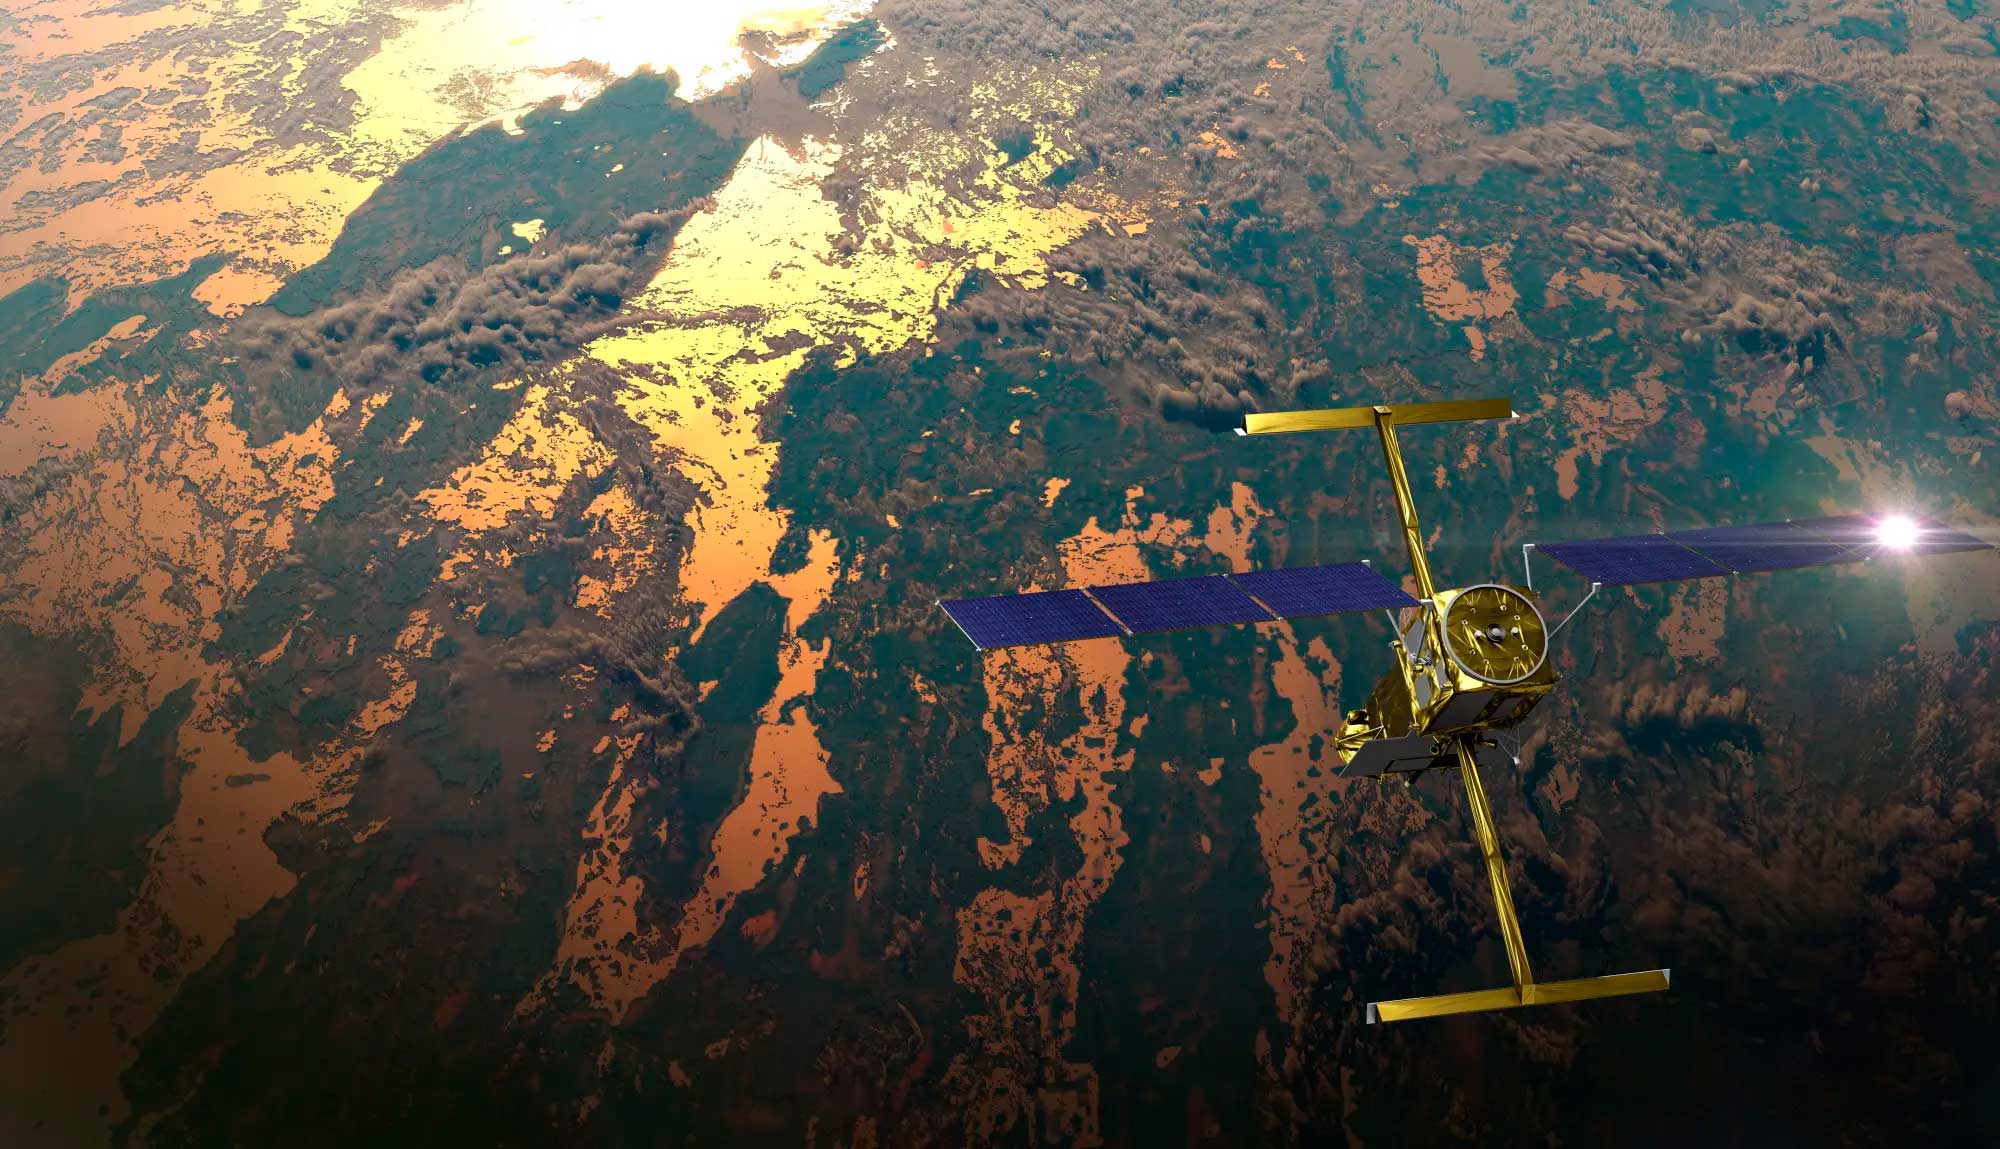
In this artist’s concept image, sunlight reflects off one of the SWOT satellite’s solar panels. The antennas of the mission’s key instrument, the Ka-band Radar Interferometer (KaRIn), collect data along a 30-mile (50-kilometer) swath on either side of the satellite. CNES
Even more surprising, the volume of the world’s longest river, the Nile, changed less than expected—by only 2.2 trillion gallons (8.5 cubic kilometers). Possible explanations include the construction of dams upstream and a severe drought, as well as difficulties associated with mastering the new satellite instrument.
Cedric David, leader of the SWOT research team at NASA’s Jet Propulsion Laboratory in Southern California, stated that the findings are the first, and the role of large floodplain dynamics remains to be fully determined. However, such analysis has remained elusive until now. In some areas, hydrological gauges are rare, and some riverbeds are too remote for boat and ground-based surveys. Long-standing questions, such as river flow rates and the volume of rain and snowmelt entering them, have compounded the uncertainty.
“We’re starting to get to the bottom of the really complex issues that SWOT analysis was designed to address,” David said. “This is just the beginning.”
Tracking rivers as they rise and fall also helps scientists visualize something difficult to observe in person: the shape of river banks and channels. Such contours influence everything from shipping to flooding, yet in many places they remain largely unmapped, noted Arnaud Serbelo, a research scientist at the Jet Propulsion Laboratory (JPL) and one of the study’s leaders.
The new SWOT data allows us to study river courses that range from concave to convex, from steep to gentle, and from stable to highly variable. For example, in the Amazon, Mississippi, Orinoco, Yangtze, Ganges, Mekong, and Yenisei rivers, observed water levels fluctuate by more than 10 meters (32 feet) from peak to trough.
“The implications of this extend far beyond hydrology and will help us understand how water moves throughout the global Earth system,” Serbelo said.
Launched in December 2022 from the Vandenberg Space Center in California, the SWOT satellite is currently in its operational phase, collecting data for research and other purposes. SWOT was developed jointly by NASA and CNES, with contributions from the Canadian Space Agency (CSA) and the UK Space Agency. NASA’s Jet Propulsion Laboratory, managed for the agency by the California Institute of Technology (Caltech) in Pasadena, California, is leading the U.S. component of the project. NASA provided the KaRIn instrument, a GPS science receiver, a laser retroreflector, and a dual-beam microwave radiometer as payloads for the flight system, and operated the NASA instruments. NASA’s partners at CNES provided the satellite-integrated Doppler orbitography and radiopositioning system, the Poseidon dual-frequency altimeter (developed by Thales Alenia Space), the KaRIn radio frequency subsystem (in collaboration with Thales Alenia Space and with support from the UK Space Agency), the satellite platform, and ground operations. The KaRIn high-power transmitter was provided by CSA. NASA provided the launch vehicle, and the agency’s Launch Program, based at Kennedy Space Center in Florida, managed the launch services.
Arctic rivers and land runoff bring huge volumes of freshwater into the Arctic Ocean, influencing seawater salinity, sea ice formation, and ocean circulation, thereby playing a vital role in regulating Earth’s heat balance.
As monitoring networks in the north of the country have shrunk, scientists have turned to satellite data to reconstruct two decades of river runoff and water discharge, revealing a striking mosaic of regional changes as rising temperatures and changing precipitation patterns unevenly and unexpectedly transform the Arctic hydrological system, ESA’s press office reported in March 2026.
Arctic rivers meander through remote tundra and boreal forests, freezing in winter and flooding in spring with melting snow, eventually emptying into the ocean. Runoff—water that flows over the land surface rather than soaking into the ground—further increases the volume of freshwater reaching the sea.
Collectively, these Arctic waters regulate the flow of freshwater into the ocean, influencing climate processes that extend far beyond the polar region. Beyond the impacts of climate change, understanding these flows is important for predicting the availability of freshwater for human and wildlife needs.
See also... New method for observing individual atoms confirms century-old quantum mechanical theory |
However, melting snow, thawing permafrost, and changing precipitation patterns are transforming these vast networks of freshwater bodies that feed the Arctic Ocean. As the Arctic warms much faster than the global average, the need to study these systems is increasing.
For decades, river flow was monitored using measuring stations installed along the banks. However, maintaining the instruments in remote Arctic regions is expensive and logistically challenging, so many stations have been decommissioned.
As a result, it’s becoming increasingly difficult for scientists to monitor how Arctic hydrology responds to rapid climate change. Satellites orbiting the Arctic offer an alternative approach.
As part of the European Space Agency’s STREAM-NEXT project to study remote sensing for society, researchers have developed a new way to estimate Arctic river runoff and surface runoff from space.
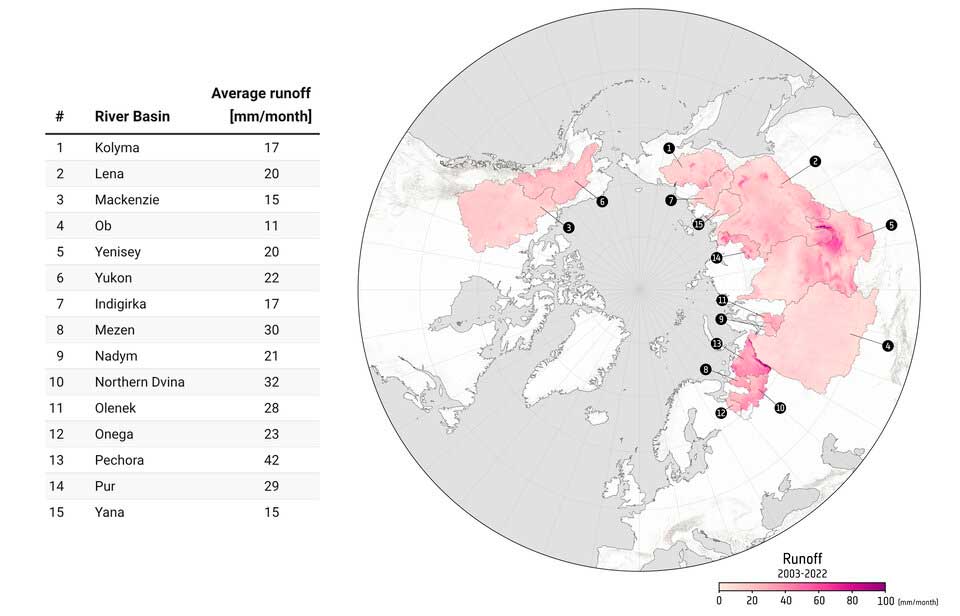
Arctic Runoff 2003–2022. ESA
A paper in the journal Remote Sensing of Environment describes how scientists used satellite observations to estimate river runoff and surface runoff across the Arctic region from 2003 to 2022.
A research team led by the Research Institute for Geohydrological Protection of the National Research Council of Italy, in collaboration with the University of Perugia, integrated water storage data from the GRACE and GRACE Follow-On gravity assist missions led by NASA’s German Aerospace Center, soil moisture data from the ESA Climate Change Initiative Soil Moisture project, snow cover data from the ESA Climate Change Initiative Snow project, and precipitation information from NASA’s IMERG data product to calculate how water moves through Arctic river systems.
This approach is based on a hydrological model specifically adapted to Arctic conditions and, importantly, instead of using local instruments, the STREAM model relies solely on satellite observations.
The model was initially calibrated using data from 15 major Arctic river basins and then extended to regions lacking instrumentation, creating a daily pan-Arctic runoff and river discharge dataset based solely on satellite data.
The map shows monthly runoff for the period 2003–2022 and identifies 15 corresponding river basins.
Using this new data-driven method, the researchers calculated that Arctic rivers deliver approximately 4,760 cubic kilometers of freshwater to the Arctic Ocean annually, which is consistent with estimates based on instrument readings and thus increases confidence in the new approach.
About 80% of this freshwater comes from Eurasian river basins, highlighting the dominant influence of Siberian drainage basins on conditions in the Arctic Ocean.
One of the study’s key findings is that hydrological changes in the Arctic are uneven. As the map shows, runoff trends varied significantly across regions between 2003 and 2022. Some areas saw increases in runoff, while others saw decreases.
Francesco Leopardi from the University of Perugia, lead author of the paper, said: “While the expected response of the pan-Arctic region to climate change suggests a general increase in runoff, estimates based on satellite data show a more heterogeneous picture.
“In the Arctic, freshwater flow changes unevenly; instead, the region exhibits patchy changes. Some areas are experiencing more water, while others, such as the Mackenzie River basin, are seeing reduced flow.”
“Overall, these results challenge the notion of a generally ‘wetter’ Arctic, highlighting instead a system undergoing uneven and regionally contrasting changes.”
This interactive graph shows daily water discharge in Canada’s Mackenzie River since 2003, where the light blue line represents measured discharge at the gauging station and the dark blue line represents model results using the STREAM model.
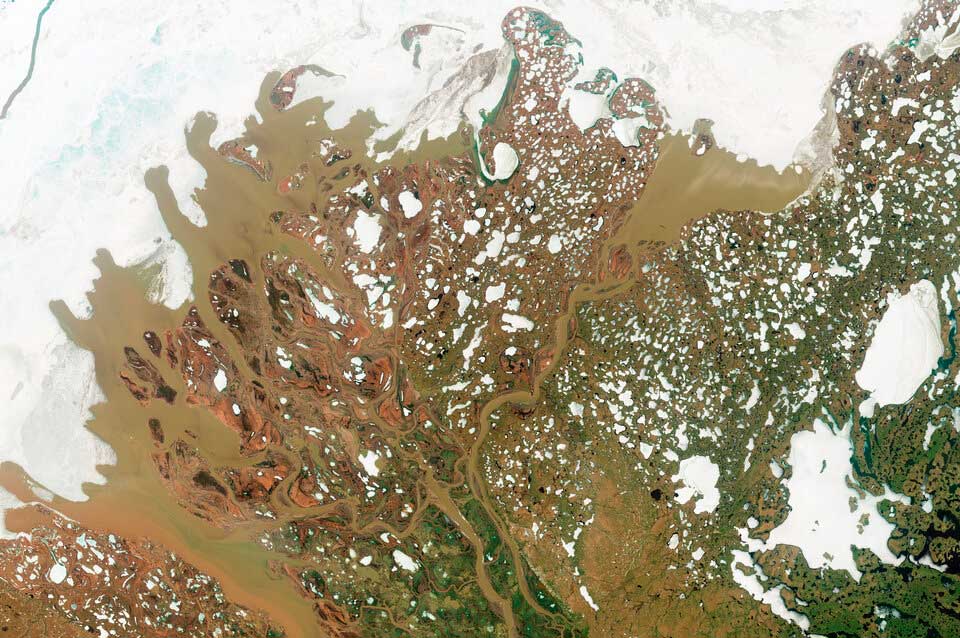
Mackenzie River. ESA
This spatial complexity reflects the interaction of factors such as rising air temperatures, changing precipitation patterns, changes in snow cover and glaciers, and the evolution of permafrost conditions.
These diverse responses are consistent with broader research showing that Arctic river systems respond differently depending on regional climate and landscape characteristics. In other words, the Arctic as a whole isn’t simply becoming wetter or drier—its water cycle is being reorganized.
Moreover, this new study highlights a broader transformation taking place in Earth observation. Satellites are increasingly serving as primary environmental monitoring systems rather than supplementary tools.
In particular, ESA’s upcoming Next Generation Gravity Mission (NGGM) will provide frequent and high-precision gravity measurements, providing unprecedented data on the distribution and transport of mass in the Earth system, including the movement of water. By repeatedly mapping Earth’s gravity field over time, scientists will be able to determine where water and ice are stored and, crucially, how these reservoirs are changing.
While using gravity to measure water storage—in rivers, lakes, groundwater, and ice—may seem counterintuitive, small temporary changes in Earth’s gravitational field reflect shifts in mass caused by changing volumes of water and ice.
NGGM will be part of one pair of satellites in the joint ESA–NASA MAGIC mission, along with a second pair of satellites from the NASA–DLR GRACE-C mission.
Remote sensing already underpins global measurements of ice loss, vegetation changes, and sea level rise. In polar regions, where field measurements are difficult and expensive, satellite hydrological data are the only practical way to maintain continuous observations over decades.
Comment on Facebook* The owner of the Meta company is recognized as extremist in Russia and is banned.See also... Complete list of HTML/Javascript event handlers with examples List of required documents for a website in the Russian Federation |